AntTracks – Memory Monitoring using Accurate and Efficient Object Tracing for Java Applications
Overview
![]()
Object allocations and garbage collection can have a considerable impact on the performance of Java applications.
Without monitoring tools, such performance problems are hard to track down, and if such tools are applied, they often cause a significant overhead and tend to distort the behavior of the monitored application.
Overview
AntTracks VM: Tracing
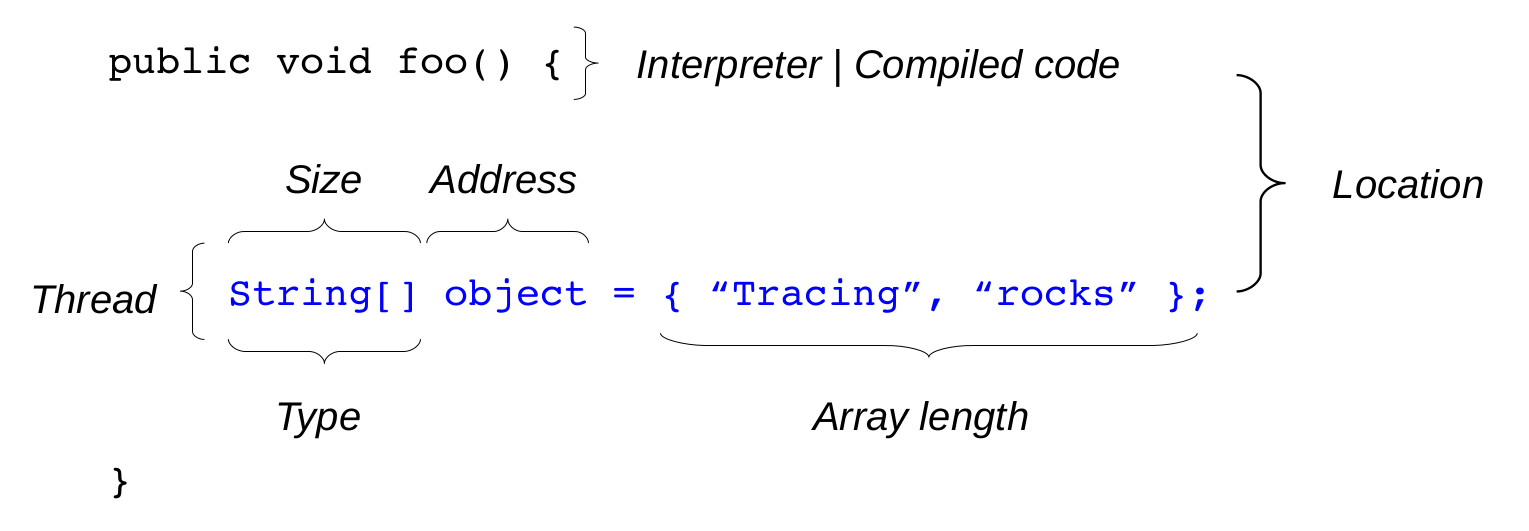
Using the AntTracks VM, you can execute and trace any Java application.
The VM will track every allocation, i.e., the allocation site (including the calling frames for frequent allocations), the allocated type, the allocating thread, the object size, as well as a number of other properties as well as object movements throughout the heap, and object deaths, i.e., when they are reclaimed by the garbage collector.
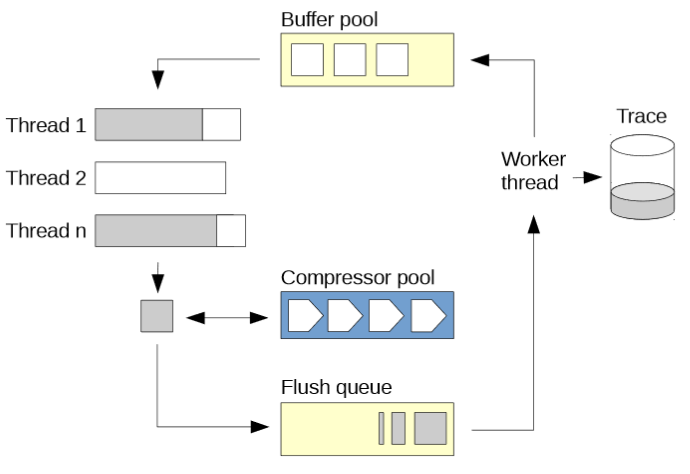
In the paper Accurate and Efficient Object Tracing for Java Applications we proposed a novel light-weight memory monitoring approach in which we trace allocations, deallocations and movements of objects using VM-specific knowledge. Information about these events is written into files for offline inspection in an analysis tool. The average run-time overhead is 4.68%, which seems to be fast enough for keeping tracing switched on even in production mode.
To keep the size of the generated trace files as small as possible, we presented different concepts such as on-the-fly-compression during trace generation or trace file rotation. More details on this can be found in Efficient and Viable Handling of Large Object Traces.
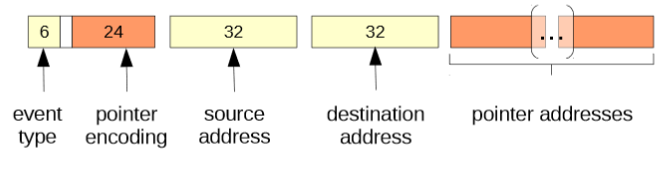
Beside an object’s type and its allocation site, the objects it references and the objects it is reference by are the most valuable information to resolve memory problems. In Efficient Memory Traces with Full Pointer Information we describe how information about the references between objects can be recorded and reconstructed with minimal overhead.
AntTracks Analyzer: Reconstruction and Memory Analysis
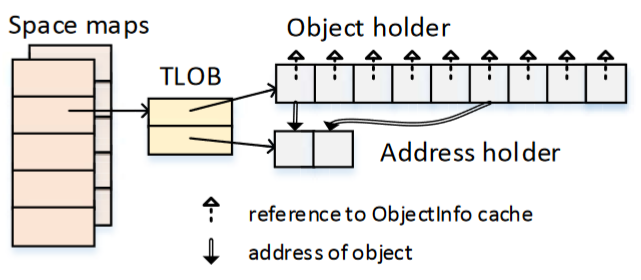
Our approach allows us to reconstruct the heap for any point in time and to do offline analyses on both the heap and on the trace. Efficient Rebuilding of Large Java Heaps from Event Traces explains how the events in a trace file can be parsed and processed concurrently, as well as how heap states can be reconstructed from a trace file.
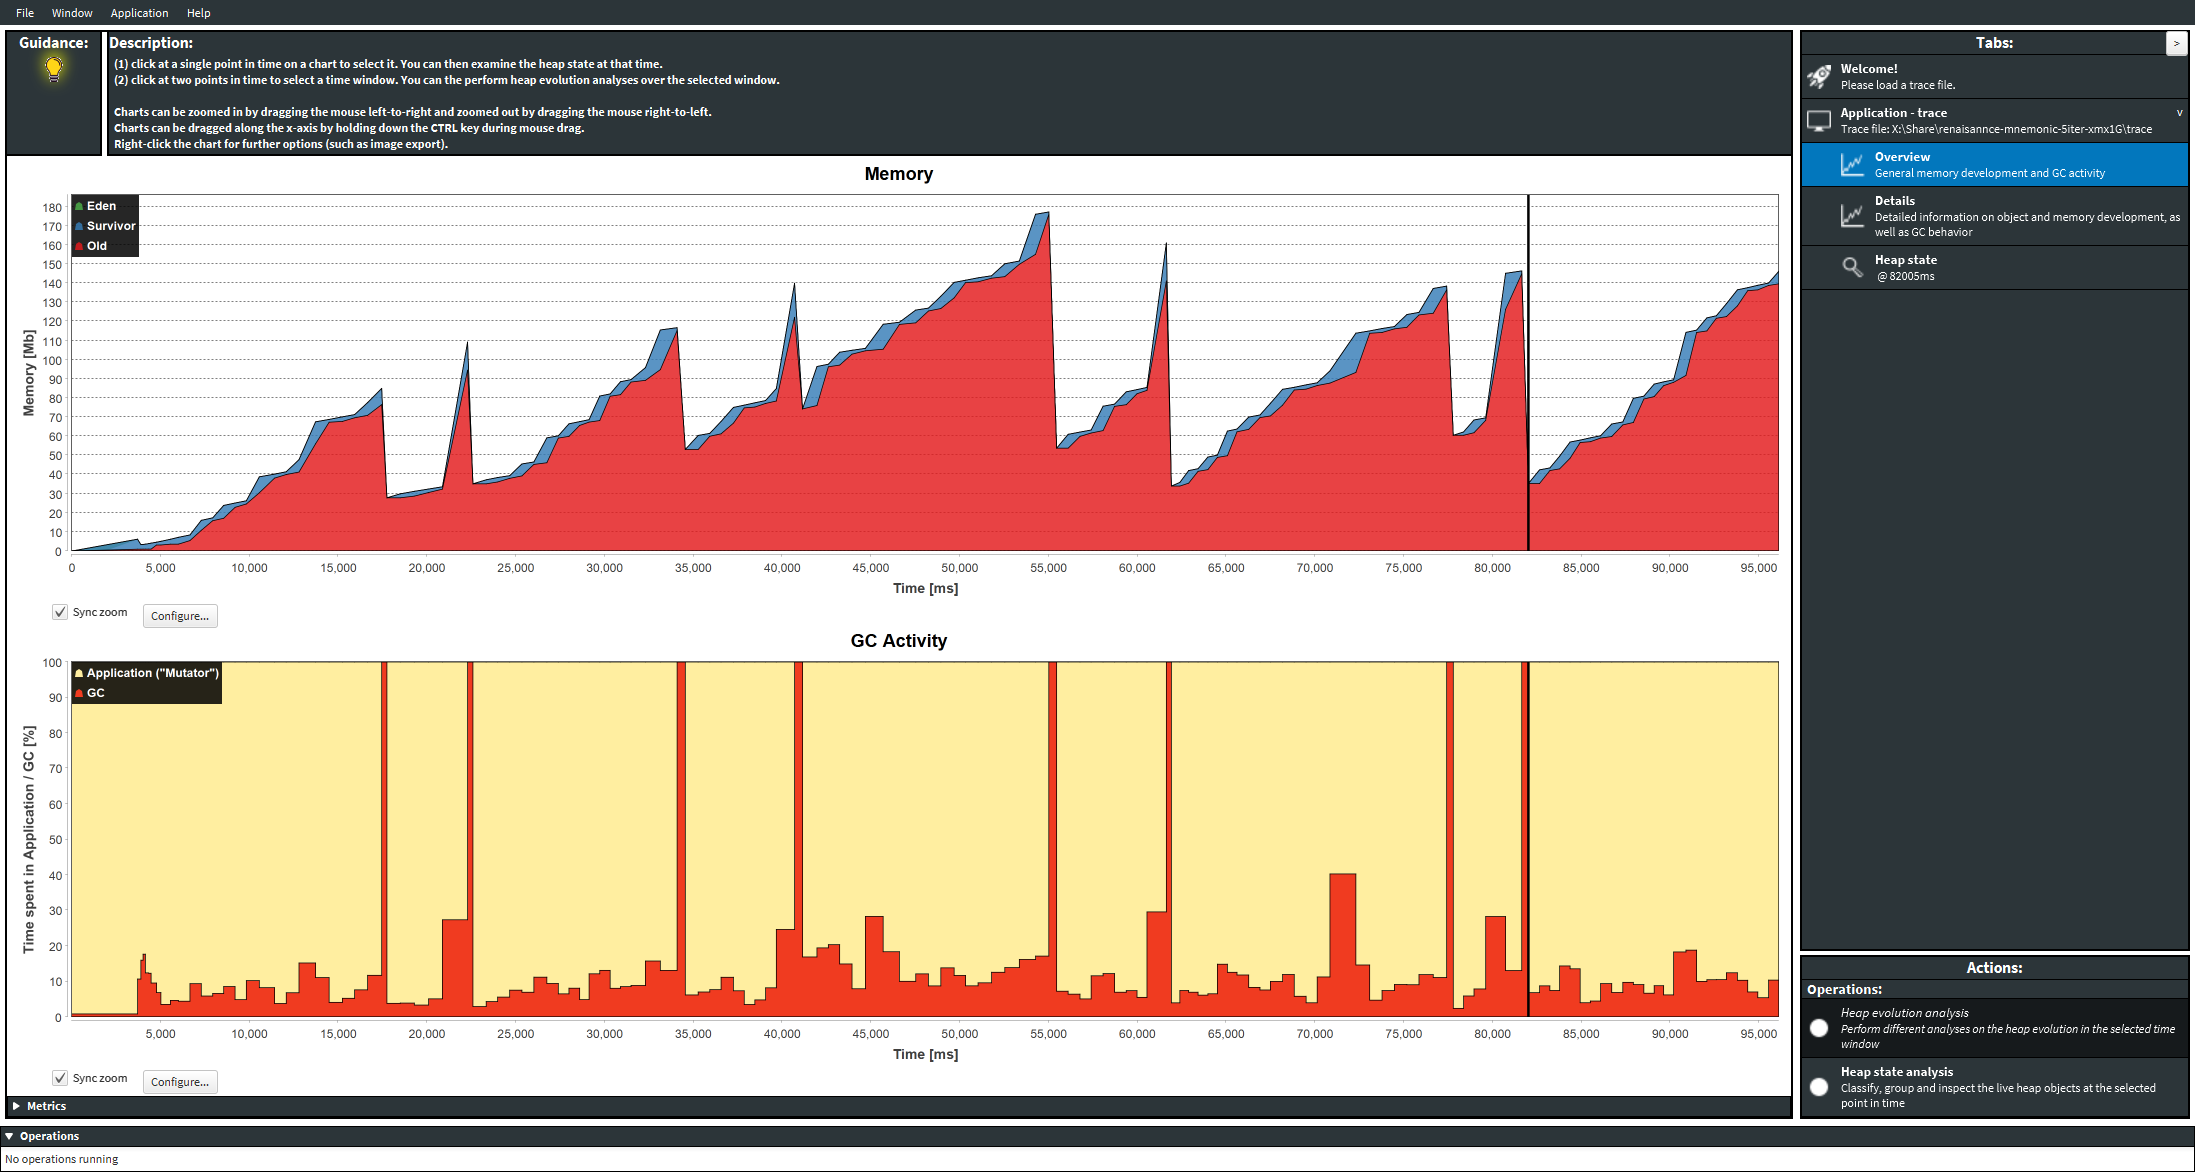
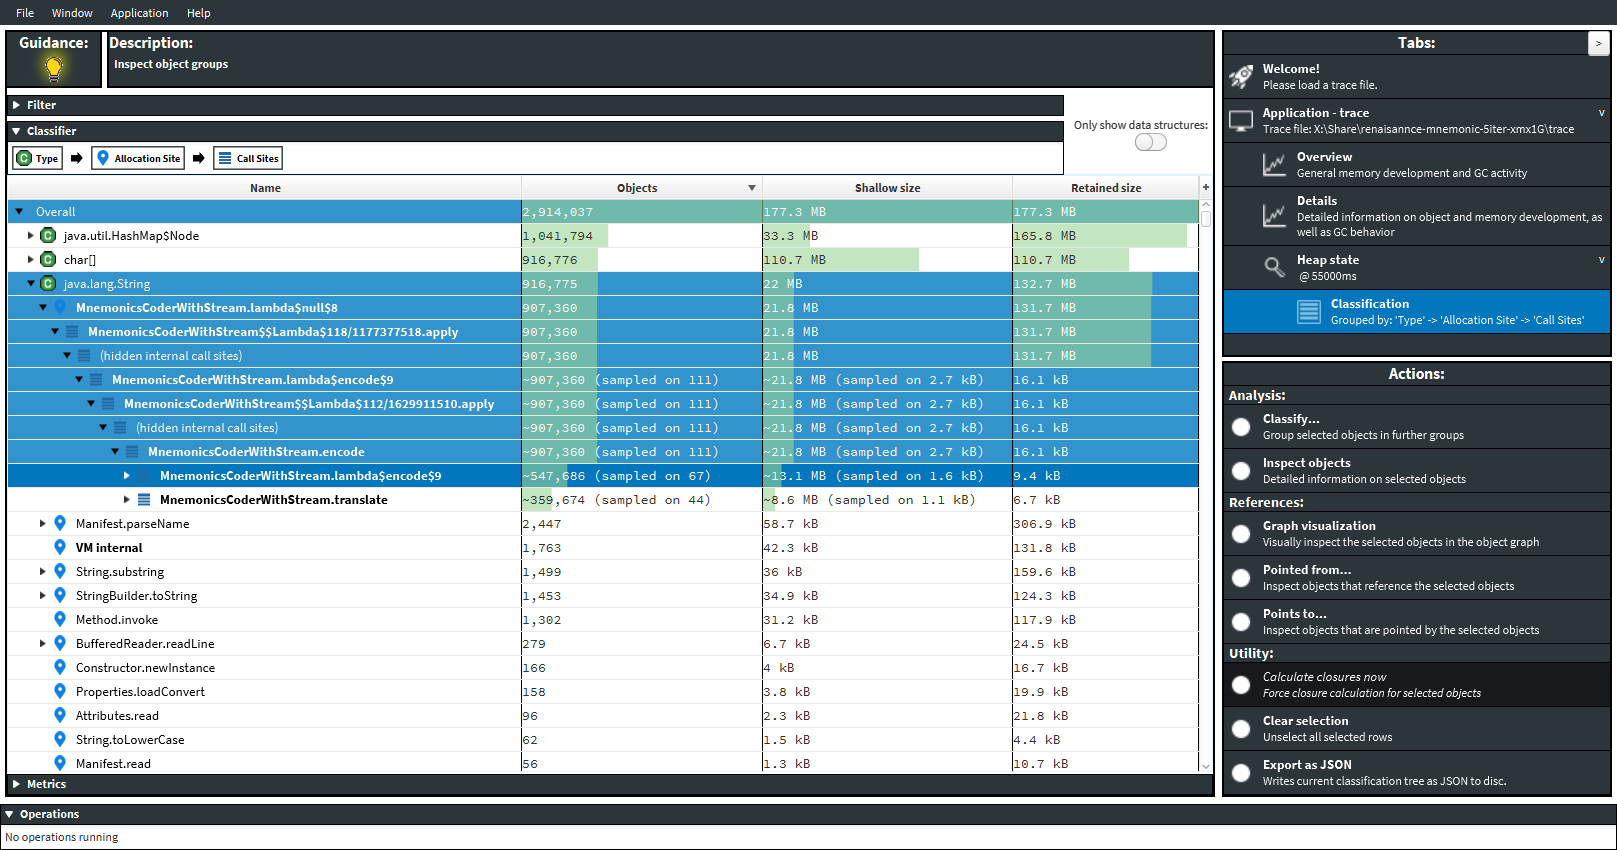
User-centered Offline Analysis of Memory Monitoring Data and User-defined Classification and Multi-level Grouping of Objects in Memory Monitoring present AntTracks’s heap state inspection. Once the heap for a certain point in time is reconstructed, users can select various classifiers, i,e., grouping criteria, based on which the heap’s objects get grouped by. Further, users can write new classifiers for detailed analysis based on their needs.

Heap objects stay alive because they are (indirectly) reachable from so-called GC roots such as static fields or thread locals. Utilizing Object Reference Graphs and Garbage Collection Roots to Detect Memory Leaks in Offline Memory Monitoring shows how information about GC roots can be collected into memory traces and how this information can be used in the Analyzer tool to find suspicious objects with a large ownership, i.e, those objects that keep alive a lot of other objects.

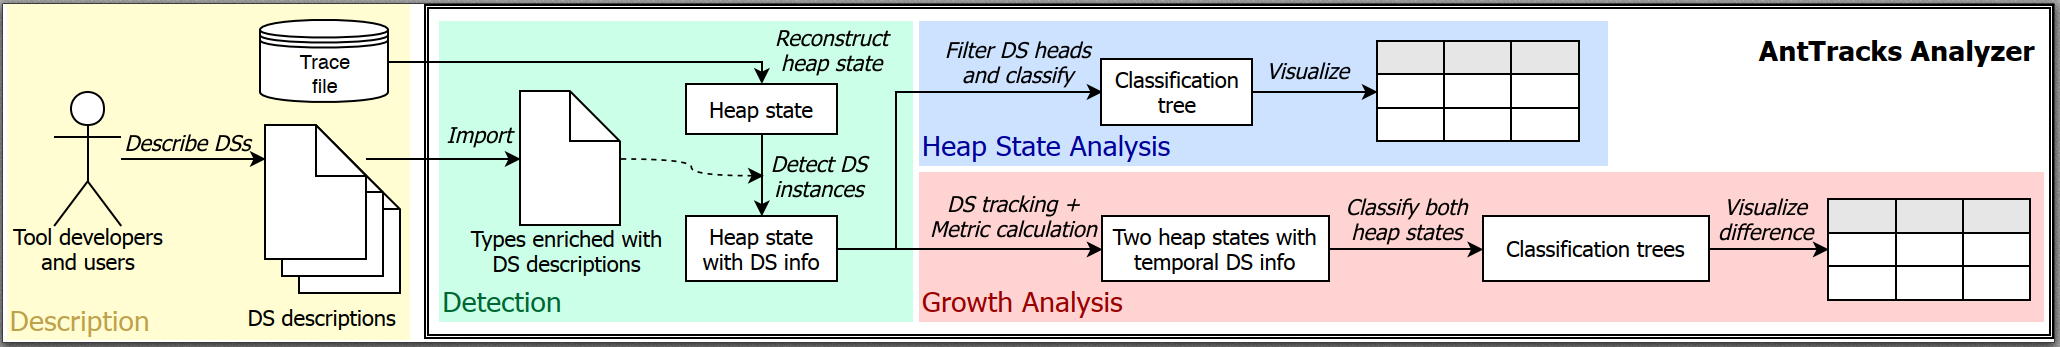
Memory leaks are often caused by incorrectly handled data structures. For example, a developer may forget to remove objects from their containing data structures. These objects cannot be reclaimed by the garbage collector and will therefore accumulate over time. In Analyzing the Evolution of Data Structures in Trace-Based Memory Monitoring and Analyzing Data Structure Growth Over Time to Facilitate Memory Leak Detection we present novel techniques how to ease the inspection of memory leaks that are caused by data structures. Data structures are described using a DSL. The AntTracks analyzer is then able to detect instances of these data structures and automatically detects those data structures that exhibit the strongest growth, an indication for a possible memory leak.
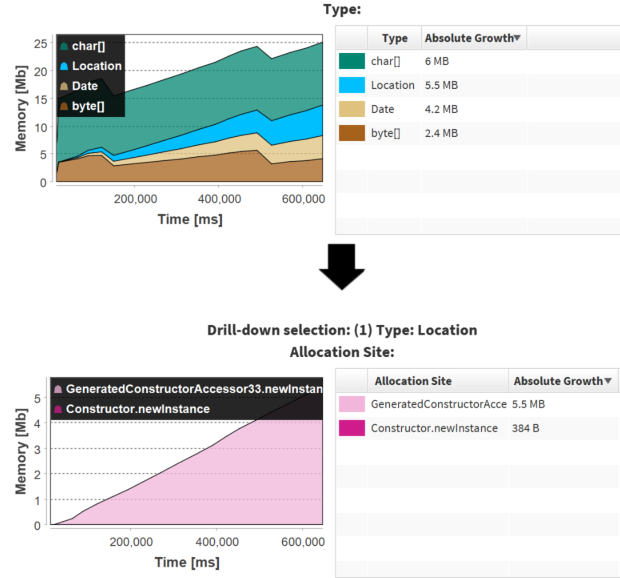
Visualizations are used in various domains to support the transfer of information. In AntTracks TrendViz: Configurable Heap Memory Visualization Over Time we present how time-series charts in combination with a drill-down approach can be used to visualize an application’s memory evolution over time.
About
This site provides downloads of our virtual machine and the analysis tool as well as tutorials on how to use both of them.
The following introduction (“Cheat Sheet”) explains the basic features of AntTracks and their usage. Please use it to get started: AntTracks Introduction (“Cheat Sheet”)
This project is a cooperation of the Institute for System Software, the Christian Doppler Laboratory for Monitoring and Evolution of Very-large-scale Software Systems and Dynatrace Austria.
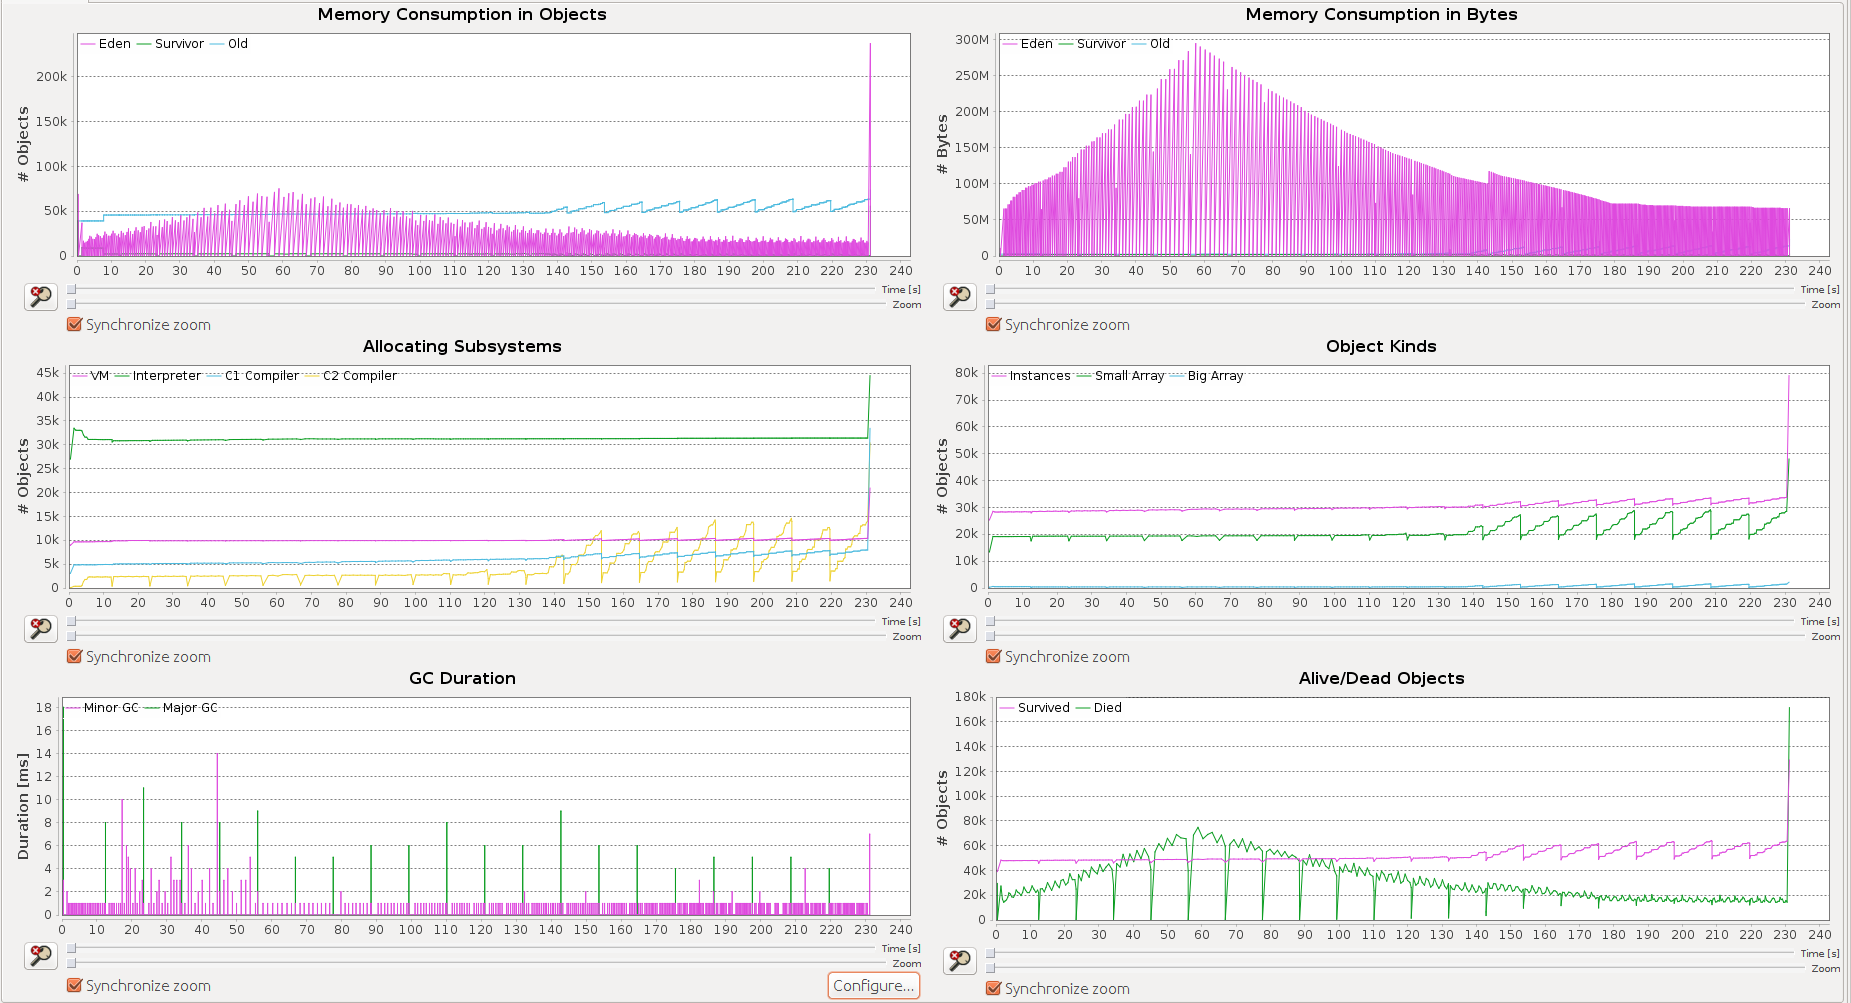
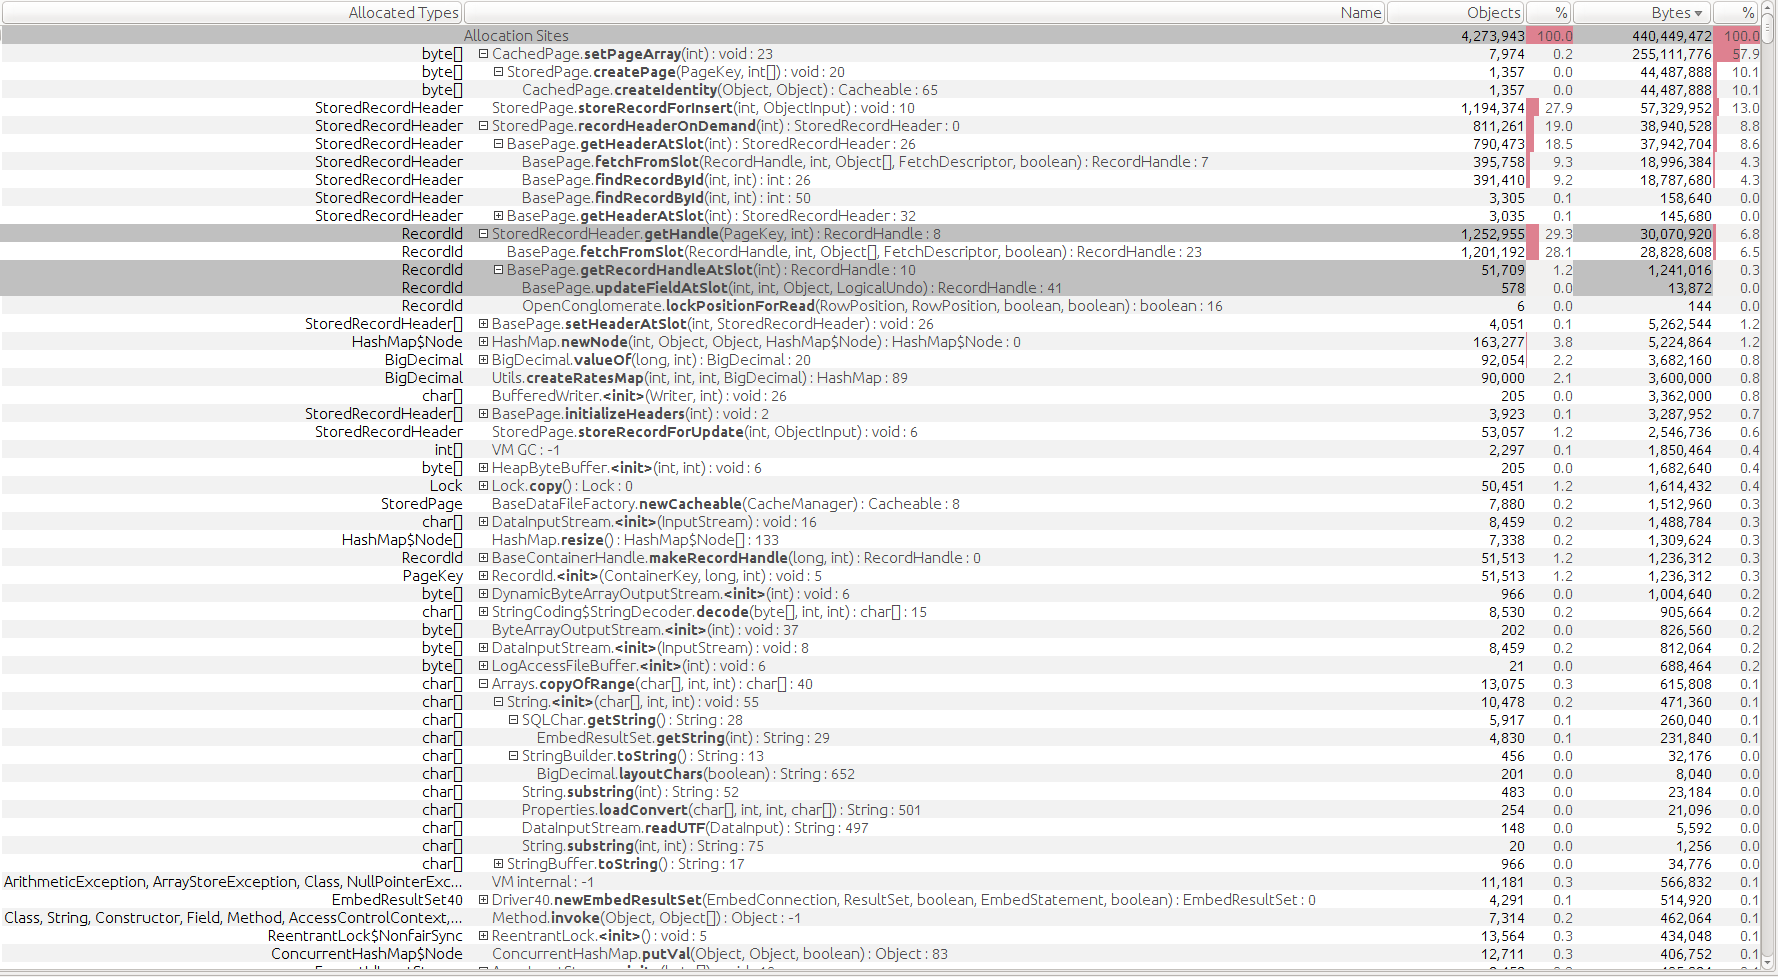
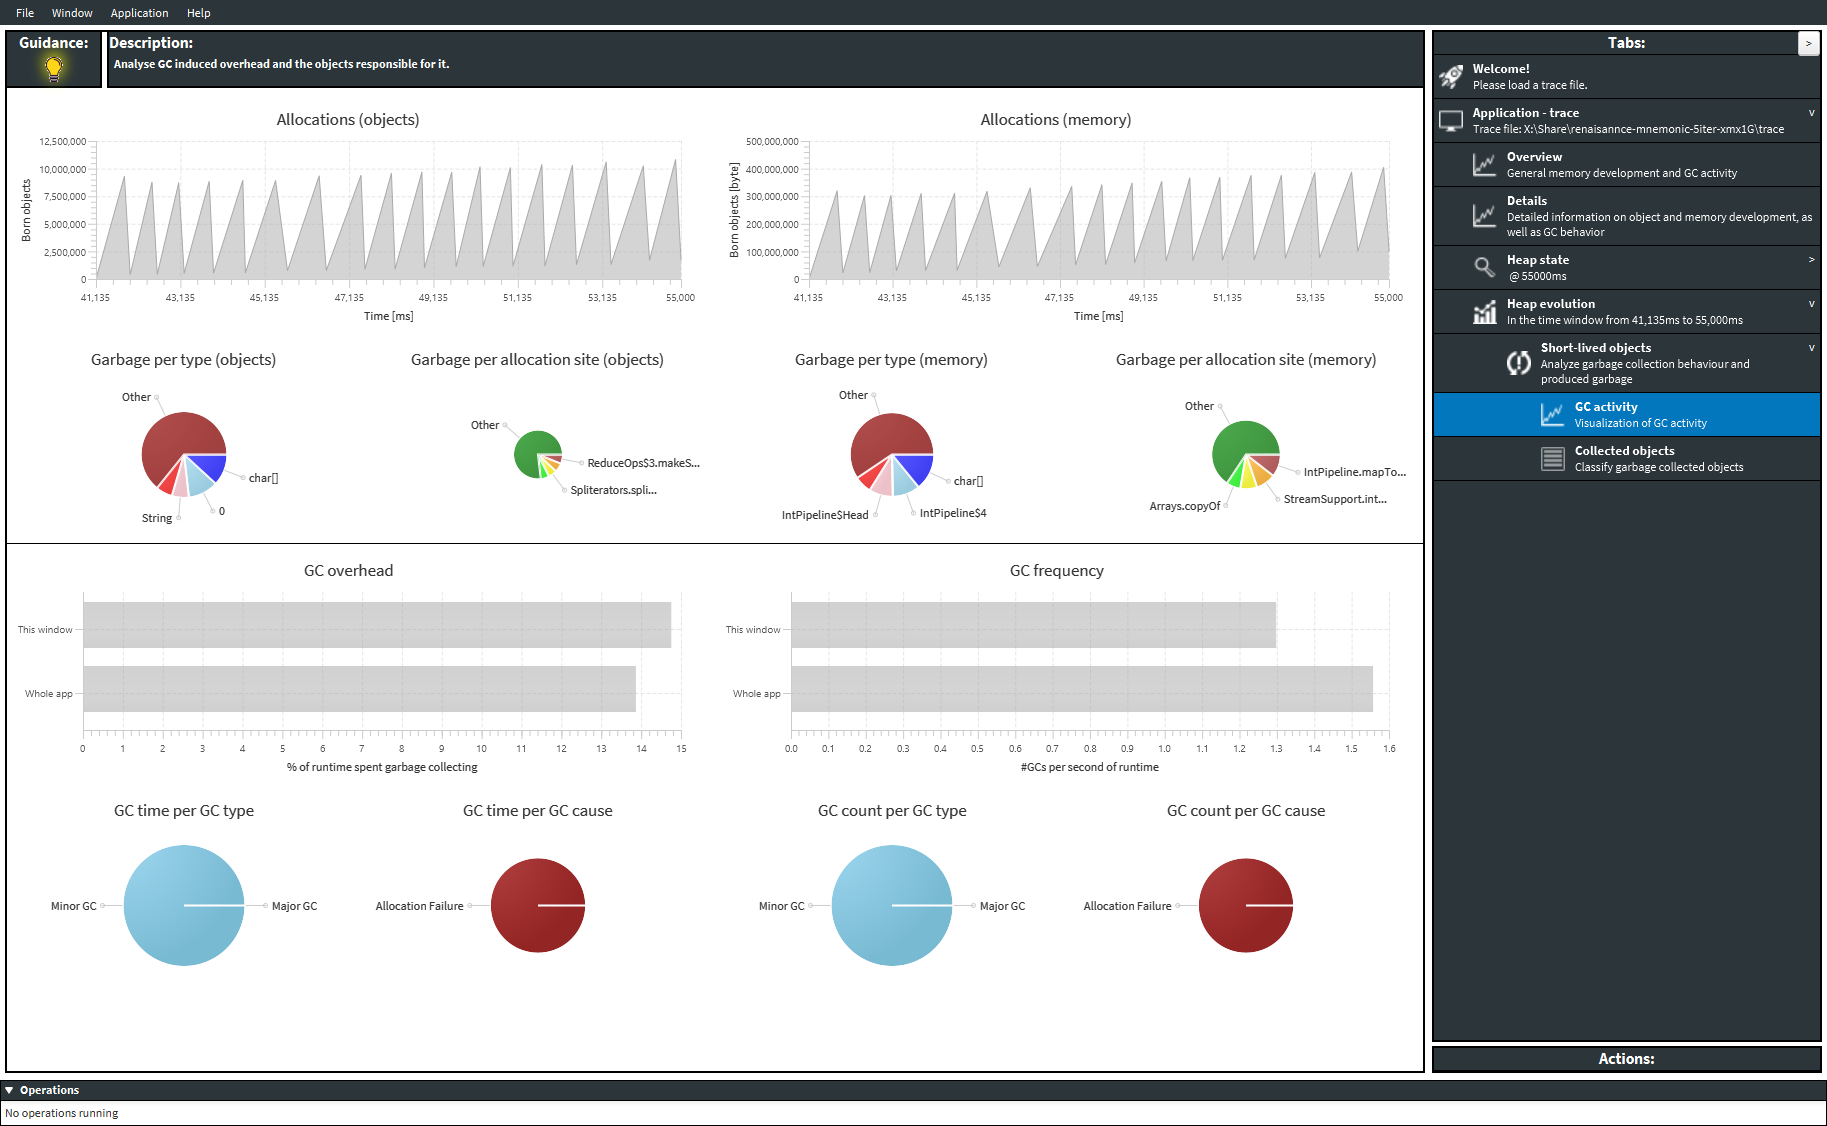
Sreenshots of the AntTracks Analyzer (2019):
Team
- Markus Weninger – Researcher
- Elias Gander – Student Researcher
Former Team Members
- Philipp Lengauer – Researcher
- Verena Bitto – Researcher
- Stefan Fitzek – Student Researcher
- Ongoing student contributions
Downloads
Download both, the AntTracks VM and the AntTracks Analyzer tool here: Download
Please note that the analysis tool is a prototype and under development. For questions, bug reports, feature requests, contributions, and/or collaborations, please contact Markus Weninger.
Usage
The virtual machine can be installed and used just as any other Java virtual machine. Without any additional parameters, it also behaves exactly like the Oracle Hotspot VM.
To enable object tracing, set the VM flag “TraceObjects” or “TraceObjectsPointers” by adding “-XX:+TraceObjects” or “-XX:+TraceObjectsPointers” right after the java command. If you run an arbitrary Java application with this flag, three files, named “symbols”, “class_def” and “trace”, will be written. They contain the full information that has been collected for the application and can be inspected in the AntTracks Analyzer tool.
The following introduction (“Cheat Sheet”) explains the basic features of AntTracks and their usage. Please use it to get started: AntTracks Introduction (“Cheat Sheet”)
Publications
- Analyzing Data Structure Growth Over Time to Facilitate Memory Leak Detection, in Proceedings of the 10th ACM/SPEC International Conference on Performance Engineering (ICPE 2019), Mumbai, India, 2019.
- AntTracks TrendViz: Configurable Heap Memory Visualization Over Time, in Proceedings of the 10th ACM/SPEC International Conference on Performance Engineering (ICPE 2019), Mumbai, India, 2019.
- Analyzing the Evolution of Data Structures in Trace-Based Memory Monitoring, in the Proceedings of the 9th Symposium on Software Performance (SSP2018), Hildesheim, Germany, 2018.
- Utilizing Object Reference Graphs and Garbage Collection Roots to Detect Memory Leaks in Offline Memory Monitoring, in
Proceedings of the 15th International Conference on Managed Languages & Runtimes (ManLang 2018), Linz, Austria, 2018. - User-defined Classification and Multi-level Grouping of Objects in Memory Monitoring, in the Proceedings of the 9th ACM/SPEC International Conference on Performance Engineering (ICPE 2018), Berlin, Germany, 2018.
- User-centered Offline Analysis of Memory Monitoring Data, in the Proceedings of the 8th ACM/SPEC International Conference on Performance Engineering (ICPE’17), L’Aquila, Italy, 2017
- A Comprehensive Java Benchmark Study on Memory and Garbage Collection Behavior of DaCapo, DaCapo Scala, and SPECjvm2008, in the Proceedings of the 8th ACM/SPEC International Conference on Performance Engineering (ICPE’17), L’Aquila, Italy, 2017
- Efficient Memory Traces with Full Pointer Information, in Proceedings of the 13th International Conference on Principles and Practices of Programming on the Java Platform: Virtual Machines, Languages, and Tools (PPPJ’16), Lugano, Switzerland, 2016
- Building Custom, Efficient and Accurate Memory Monitoring Tools for Java Application Tutorial at the 7th ACM/SPEC International Conference on Performance Engineering (ICPE’16), Delft, Netherlands, 2016
- Building Custom, Efficient and Accurate Memory Monitoring Tools for Java Application in the Proceedings of the 7th ACM/SPEC International Conference on Performance Engineering (ICPE’16), Delft, Netherlands, 2016
- Efficient and Viable Handling of Large Object Traces, in Proceedings of the 7th ACM/SPEC International Conference on Performance Engineering (ICPE’16), Delft, Netherlands, 2016
- Efficient Rebuilding of Large Java Heaps from Event Traces, in Proceedings of the 12th ACM International Conference on Principles and Practice of Programming on the Java Platform: virtual machines, languages, and tools (PPPJ’15), Melbourne, FL, USA, 2015
- Accurate and Efficient Object Tracing for Java Applications, in Proceedings of the 6th ACM/SPEC International Conference on Performance Engineering (ICPE’15), Austin, TX, USA, 2015
- Post-Mortem Memory Profiling for Java Applications, Master’s Thesis Philipp Lengauer, Johannes Kepler University, Linz, Austria, 2015
Media
AntTracks Introduction (“Cheat Sheet”)
The following introduction (“Cheat Sheet”) explains the basic features of AntTracks and their usage. Please use it to get started: AntTracks Introduction (“Cheat Sheet”)
Sreenshots (Aug 2019):
Screenshots (2016):