Efficient Tracing and Versatile Analysis of Lock Contention in Java Applications on the Virtual Machine Level
Overview
![]()
Multi-core processors have become the norm from server-class machines to phones, and software developers must write concurrent code to benefit from their increasing processing power. However, implementing correct and scalable locking for accessing shared resources remains a challenge. Examining lock contention in an application at run time is vital to determine where more sophisticated but error-prone locking pays off.
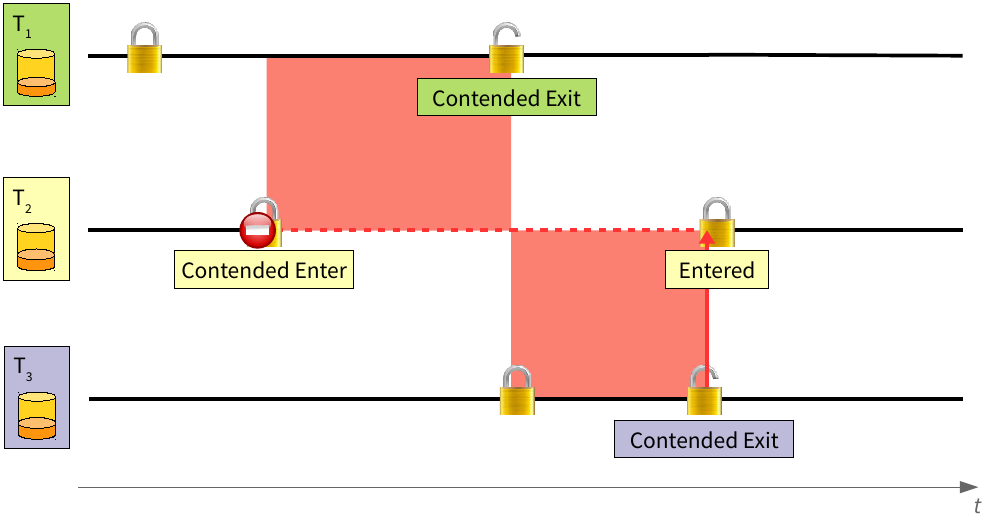
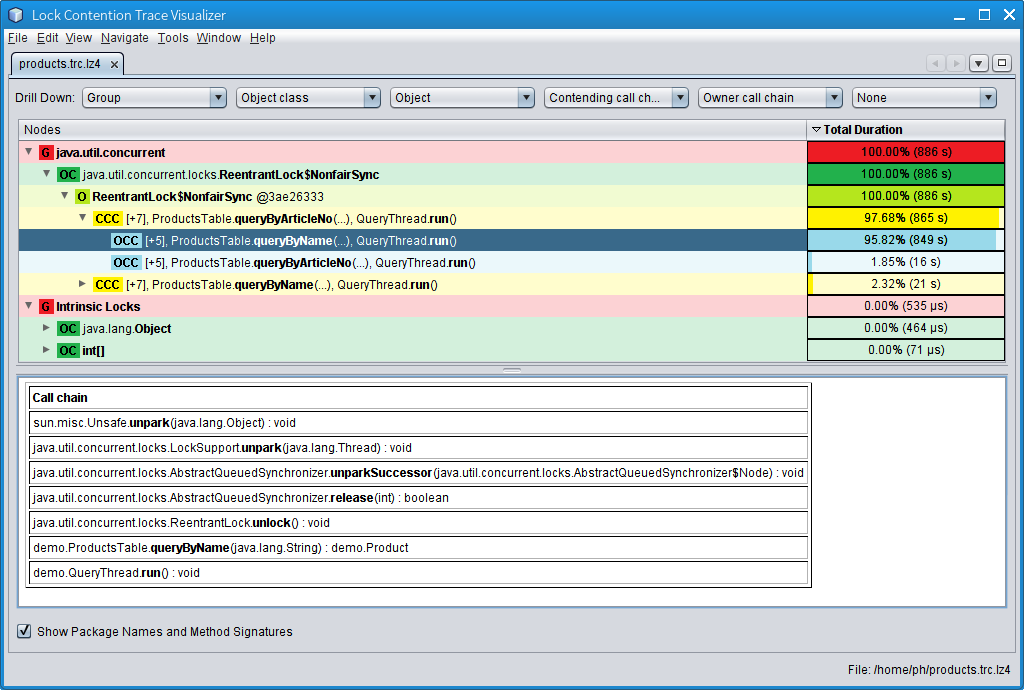
In our paper Efficient Tracing and Versatile Analysis of Lock Contention in Java Applications on the Virtual Machine Level, we describe a novel approach for analyzing lock contention in Java applications by tracing locking events in the Java Virtual Machine. Unlike common methods, our approach observes not only when a thread is blocked on a lock, but also which other thread blocked it by holding that lock, and records both their stack traces. This reveals the causes of lock contention instead of showing only its symptoms. We further devised a versatile tool for the analysis of the traces which enables users to identify locking bottlenecks and their characteristics in an effective way. We implemented our approach in the widely used HotSpot Virtual Machine, and with a mean run-time overhead of 7.8% for real-world multi-threaded benchmarks, we consider it efficient enough to monitor production systems.
On this website, we provide downloads for our prototype Java Development Kit (JDK) and for our trace analysis tool, as well as their source code.
Our research is supported by Dynatrace Austria and by the Christian Doppler Forschungsgesellschaft.


Team
- Peter Hofer (contact for inquiries)
- David Gnedt
- Andreas Schörgenhumer
- Hanspeter Mössenböck
Downloads
Please cite as: Efficient Tracing and Versatile Analysis of Lock Contention in Java Applications on the Virtual Machine Level, in Proceedings of the 7th ACM/SPEC International Conference on Performance Engineering (ICPE’16), Delft, Netherlands, 2016.
On this page, you can download our prototype of a Java Development Kit (JDK) which traces lock contention in the executed application, as well as our analysis tool that visualizes the generated traces. All of our code is licensed under the GNU Public License (Copyright Dynatrace 2014, 2015).
Please contact Peter Hofer with questions.
Stable Version
This is the JDK and analysis tool as we describe it in our paper, plus minor improvements. The JDK is based on OpenJDK 8 (8u102-b14) and is fully compatible to OpenJDK 8. The JDK is supported only on Linux on 64-bit x86 hardware.
| Java Development Kit | Binary Distribution Download (Linux x86-64; 67 MB) |
|---|---|
| Source Code Use Mercurial to clone the OpenJDK source tree from: http://hg.openjdk.java.net/jdk8u/jdk8u/Apply these patches: Patch for hotspot subrepository (apply on jdk8u102-b14, commit ac29c9c1193a) Patch for jdk subrepository (apply on jdk8u102-b14, commit 48c99b423839)Follow the OpenJDK 8 build instructions. |
|
| Trace Analysis Tool | Java Application (platform-independent; 18 MB)
Extract and run with the launchers in the bin/ subdirectory. |
Experimental Version
This version of our JDK is based on OpenJDK 9 (9b140) and exclusively supports tracing VM-internal native locks. We tested the JDK only on Linux on 64-bit x86 hardware, but it should require only few changes to work on other platforms. Use the analysis tool of the stable version to analyze the traces.
| Java Development Kit | Binary Distribution Download (Linux x86-64; 157 MB) |
|---|---|
| Source Code Clone the source tree from: http://hg.openjdk.java.net/jdk9/jdk9/Apply these patches: Patch for hotspot subrepository (apply on jdk-9+140, commit fec31089c2ef) Patch for jdk subrepository (apply on jdk-9+140, commit e93b7ea55975)Follow the OpenJDK 9 build instructions. |
|
| Trace Analysis Tool | Use the trace analysis tool provided for the stable version above. |
Original Version
This is the exact JDK and analysis tool as described and evaluated in our paper. The JDK is based on OpenJDK 8 (8u45-b14) and is fully compatible to OpenJDK 8. The JDK is supported only on Linux on 64-bit x86 hardware.
| Java Development Kit | Binary Distribution Download (Linux x86-64; 67 MB) |
|---|---|
| Source Code Clone the source tree from: http://hg.openjdk.java.net/jdk8u/jdk8u/Apply these patches: Patch for hotspot subrepository (apply on jdk8u45-b14, commit 5321d26956b2) Patch for jdk subrepository (apply on jdk8u45-b14, commit 20e6cadfac43)Follow the OpenJDK 8 build instructions. |
|
| Trace Analysis Tool | Java Application (platform-independent; 16 MB) |
JDK Usage
Our Java Development Kit (JDK) is based on OpenJDK and is fully compatible to OpenJDK in terms of the provided executables, the Java class library and language support, and even specific command-line parameters. Therefore, our JDK is suitable as a drop-in replacement for an existing OpenJDK installation and typically also for an Oracle JDK installation. Our additional lock contention tracing features must be enabled explicitly with command-line parameters, most importantly -XX:+EnableEventTracing and -XX:EventTracingConfiguration=<configuration>.
For example, the following command launches the Java application from application.jar with event tracing enabled, and the trace is written to the file /some/path/file.trc:
/path/to/java

-XX:+EnableEventTracing

-XX:EventTracingConfiguration=Output=/some/path/file.trc

-jar application.jar
Description of the most important parameters related to lock contention tracing:
| Flag | Description |
|---|---|
| EnableEventTracing | Activates tracing lock contention events (disabled by default).Example: -XX:+EnableEventTracing to enable.-XX:-EnableEventTracing to disable (default). |
| EventTracingConfiguration | Configuration string that specifies how the recorded events should be processed. Output specifies that recorded events should be written to an uncompressed file. Statistics performs an online analysis of recorded events and writes the results to a text file on exit. The path of the output file can be specified, or alternatively, a file with a pre-defined name (output.trc or trace-statistics.txt) will be created in the current directory. In either case, existing files are overwritten without prompt.
Examples: |
| EnableEventTracingParkEvents | Activates tracing park and unpark calls (on by default). This captures contention from synchronization mechanisms implemented in Java, such as ReentrantLock and ReentrantReadWriteLock and most other code in java.util.concurrent. When disabled, only contention from Java intrinsic locks (monitors) is captured.Example:-XX:-EnableEventTracingParkEvents to disable. |
| EventTracingBufferCapacity | The size of a per-thread trace buffer in bytes (default: 16384). Increasing this value increases memory usage, but reduces buffer management cost. Note that actual buffer sizes are randomized, with this value being the mean buffer size.Example:-XX:EventTracingBufferCapacity=32768 |
| EnableEventTracingStackTraces | Enables capturing stack traces for trace events (on by default).Example:-XX:-EnableEventTracingStackTraces to disable. |
| EventTracingStackDepthLimit | Specifies the maximum number of stack frames (not including inlined frames) that are captured in one stack walk (default: 128). Increasing this might require increasing EventTracingBufferCapacity as well.Example:-XX:EventTracingStackDepthLimit=64 |
Analysis Tool Usage
Please watch our video for instructions on how to use our analysis tool.
Publications
- Efficient Sampling-based Lock Contention Profiling in Java, in Proceedings of the 8th ACM/SPEC International Conference on Performance Engineering (ICPE’17), L’Aquila, Italy, 2017.
- Efficient Sampling-based Lock Contention Profiling in Java, Master’s Thesis, Andreas Schörgenhumer, Johannes Kepler University, Linz, Austria, 2017.
- Method Profiling and Lock Contention Profiling on the Java Virtual Machine Level, PhD Thesis, Peter Hofer, Johannes Kepler University, Linz, Austria, 2016.
- Runtime Analysis of High-Level Java Synchronization Mechanisms on the Virtual Machine Level, Master’s Thesis, David Gnedt, Johannes Kepler University, Linz, Austria, 2016.
- Efficient Tracing and Versatile Analysis of Lock Contention in Java Applications on the Virtual Machine Level, in Proceedings of the 7th ACM/SPEC International Conference on Performance Engineering (ICPE’16), Delft, Netherlands, 2016.
- Efficient Dynamic Analysis of the Synchronization Performance of Java Applications, in Proceedings of the 13th International Workshop on Dynamic Analysis (WODA’15), Pittsburgh, PA, USA, 2015.
