
Application Performance Management
Motivation
Application Performance Management (APM) deals with analyzing the runtime behavior of software systems and monitoring their response time and resource consumption. In one part of our research we concentrate on the monitoring of Java programs and try to answer the research question of how an ideal Java VM should look like that provides analysis tools with the necessary information about executed programs. In particular we work on memory monitoring (collecting data about allocated objects with their types and live times, allocation sites, allocating threads, and the garbage collection behavior), execution monitoring (collecting execution profiles with method frequencies and dynamic calling contexts), and thread monitoring (analyzing the synchronization between threads, their locking behavior and their waiting times). This includes investigating anomalies such as memory leaks or race conditions.
In the other area of research we focus on monitoring and analysis of large heterogeneous systems consisting of multiple components and complex interdependencies. Based on the huge amounts of data provided by our industry partner, our aim is to automatically identify erroneous situations such as crashes in system components and to find meaningful patterns and classifications.
Approach
Part of our research is based on Oracle’s Java HotSpot VM, which is one of the most widely used Java execution environments. Profiles are collected by dynamic instrumentation of programs, by efficient sampling techniques and by modifications of VM components such as the bytecode interpreter, the JIT compiler, and the garbage collector. Furthermore, we produce traces of relevant events during a program’s execution and use them for analysis and data mining. Finally, we apply various visualization techniques to show event traces, heap layouts, and dynamic calling context trees on various abstraction layers and with sophisticated filtering and searching mechanisms.
For analyzing large heterogeneous systems, we use a sophisticated data representation on which we apply various statistical evaluations, clustering algorithms and other machine learning approaches. Another challenge is to find appropriate visualizations for the evaluation results and for the large systems themselves.
Results
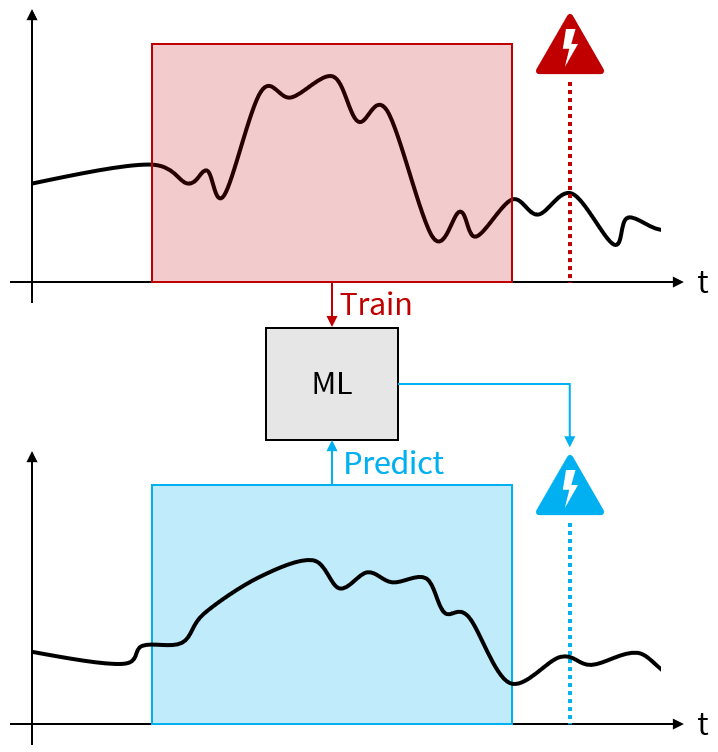 Performance Event Prediction with Multi-System Monitoring Time Series. Predicting performance-related events is a crucial part of proactive fault management in today’s software systems. Much research has been done in the area of single systems. Multi-system environments, however, have not yet been investigated as much, despite the potential benefits, such as being able to work with limited data and even to create predictions for unseen, new systems. We thus developed a multi-system event prediction approach that uses infrastructure monitoring data (CPU, memory, disk metrics, etc.) to predict performance slowdown events. First results with data from 90 independent systems over a period of 20 days show promising prediction capabilities with accuracies and F1-scores over 90% and false-positive-rates below 10%. The best multi-system results were achieved when using clustering techniques to create machine learning models for groups of similar systems.
Schörgenhumer, A.; Kahlhofer, M.; Chalupar, P.; Mössenböck, H.; Grünbacher, P.: Using Multi-System Monitoring Time Series to Predict Performance Events. 9th Symp. on Software Performance (SSP’18), November 8-9, 2018, Hildesheim, Germany.
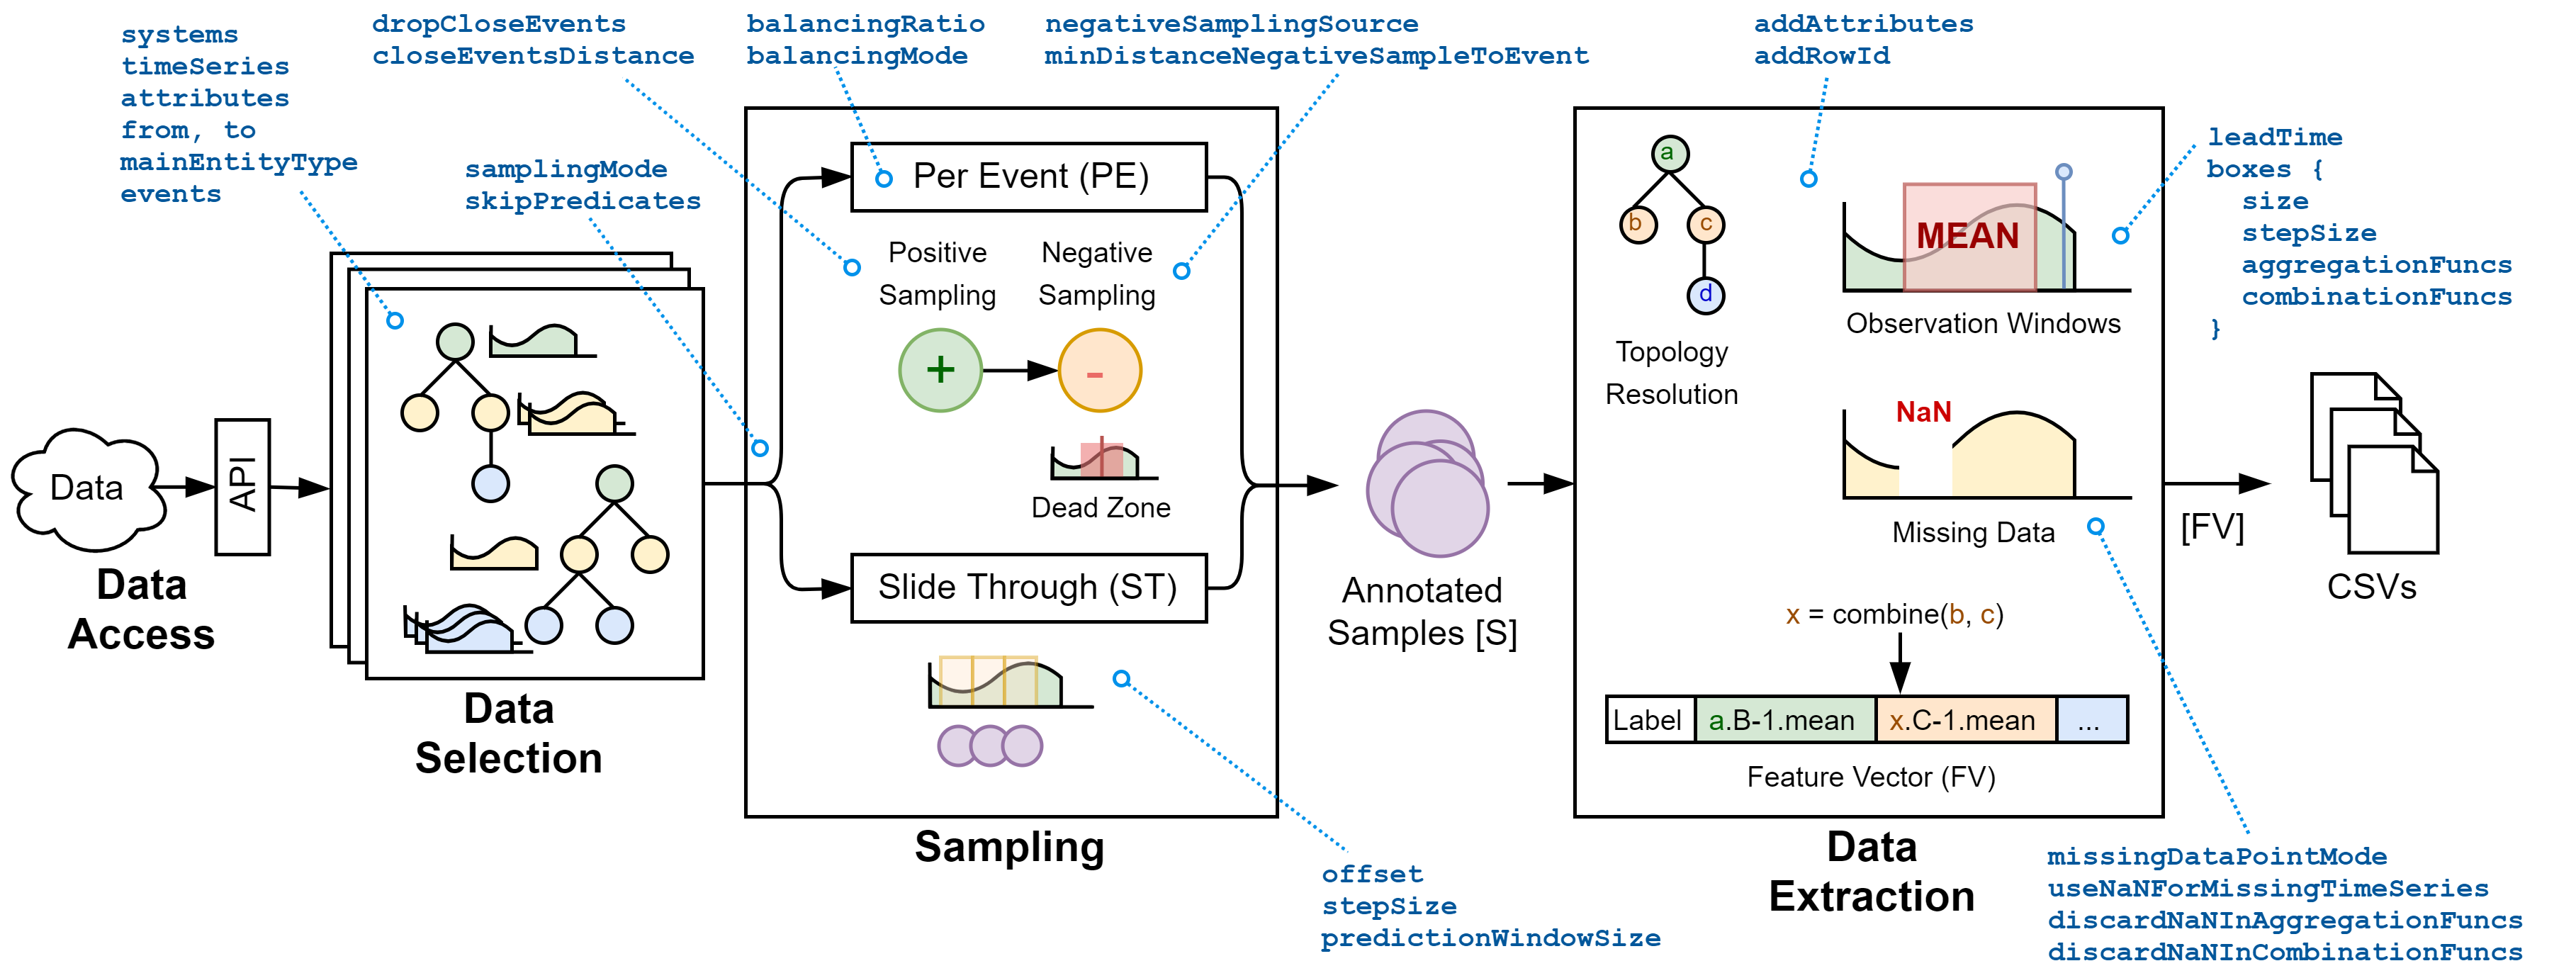 Preprocessing Framework for Multi-System Time Series and Event Data. Machine learning is widely used for data analysis in software systems. However, the raw data must first be processed adequately, which often entails tedious work. We developed a preprocessing framework that can aid users in such tasks. Specifically, we created a tool that can handle multivariate time series data and event data from multiple systems. Users of the framework must simply provide access to the raw data and write YAML configuration files, which contain all the necessary preprocessing information they would like to be applied to the raw data. Among many other things, configuration options include which components of the system to inspect, the definition of observation windows for the time series, how data should be aggregated or how missing data should be handled. As a result, the framework yields CSV files containing feature vectors, which can be used for further processing or directly as input for machine learning algorithms.
Schörgenhumer, A.; Kahlhofer, M.; Chalupar, P.; Grünbacher, P.; Mössenböck, H.: A Framework for Preprocessing Multivariate, Topology-Aware Time Series and Event Data in a Multi-System Environment. 19th IEEE Int’l Symp. on High Assurance Systems Engineering (HASE’19), January 3-5, 2019, Hangzhou, China.
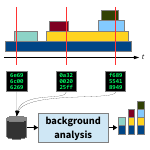
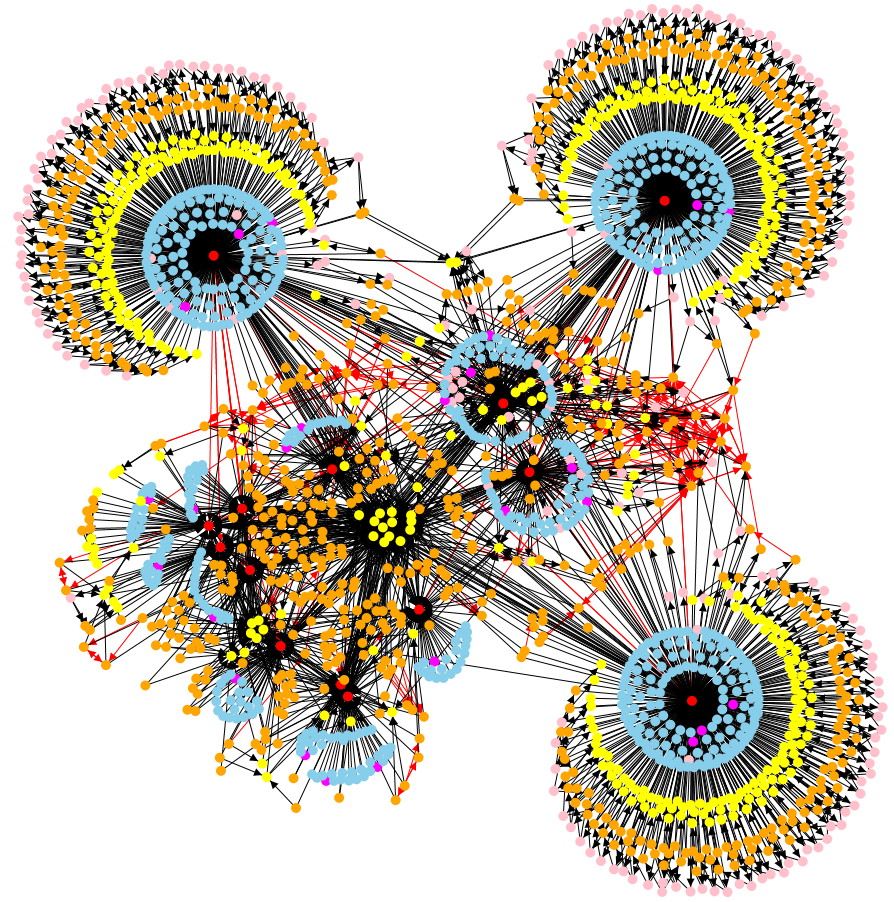 Detecting toxic software configurations. In large and heterogeneous software systems, crashes of individual components are a frequent phenomenon and can lead to slowdowns and even to total system failures. Root-cause analysis tries to find reasons for these crashes based on recorded monitoring data. One possible reason are toxic software configurations, i.e., configurations of components which fail to cooperate properly (e.g., because of version incompatibilities). We represent systems of components in dynamic graphs that change over time, and relate them to crashes which occur at certain nodes at some points in time. Based on this data, we apply various statistical evaluations, such as Principal Components Analysis (PCA) and Association Rule Learning, as well as visualization techniques to identify toxic configurations.
Schörgenhumer, A.; Kahlhofer, M.; Mössenböck, H.; Grünbacher, P.: Using Crash Frequency Analysis to Identify Error-Prone Software Technologies in Multi-System Monitoring. 18th IEEE Int’l Conf. on on Software Quality, Reliability and Security (QRS’18), July 16-20, 2018, Lisbon, Portugal.
Lock contention tracing. Software developers must write concurrent code to benefit from multiple cores and processors, but implementing correct and scalable locking for accessing shared resources remains a challenge. Examining lock contention in an application at run time is vital to determine where more sophisticated but error-prone locking pays off. We devised a novel approach for analyzing lock contention in Java applications by tracing locking events in the Java HotSpot Virtual Machine. Unlike common methods, our approach observes not only when a thread is blocked on a lock, but also which other thread blocked it by holding that lock, and records both their stack traces. This reveals the causes of lock contention instead of showing only its symptoms. We further devised a versatile tool for the analysis of the traces which enables users to identify locking bottlenecks and their characteristics in an effective way. With a mean run-time overhead of 7.8% for real-world multi-threaded benchmarks, we consider our approach to be efficient enough to monitor production systems. More details and downloads…
In addition to our VM-internal lock contention tracing, we also developed a sampling-based lock contention profiler which is independent of a specific VM. This profiler records the same level of detail as our VM-internal approach, which includes monitoring both where lock contention occurs and where it it caused. When sampling with 100 samples/second, we achieved a mean run-time overhead of only about 5%. We also compared the results of the sampling-based approach with those of the VM-internal tracing and found that the accuracy of our new profiler is sufficiently high.
Schörgenhumer, A.; Hofer, P.; Gnedt, D.; Mössenböck, H.: Efficient Sampling-based Lock Contention Profiling in Java. 8th Int’l Conf. on Performance Engineering (ICPE’17), April 22-26, 2017, L’Aquila, Italy.
Schörgenhumer, A.: Efficient Sampling-based Lock Contention Profiling in Java. Master’s Thesis, February, 2017, Johannes Kepler University, Linz, Austria.
Hofer, P.: Method Profiling and Lock Contention Profiling on the Java Virtual Machine Level. PhD Thesis, October, 2016, Johannes Kepler University, Linz, Austria.
Hofer, P.; Gnedt, D.; Schörgenhumer, A.; Mössenböck, H.: Efficient Tracing and Versatile Analysis of Lock Contention in Java Applications on the Virtual Machine Level. 7th Int’l Conf. on Performance Engineering (ICPE’16), March 12-18, 2016, Delft, The Netherlands.
Hofer, P.; Gnedt, D.; Mössenböck, H.: Efficient Dynamic Analysis of the Synchronization Performance of Java Applications. 13th Int’l Workshop on Dynamic Analysis (WODA’15) co-located with SPLASH’15, Oct 26, 2015, Pittsburgh, PA, USA.
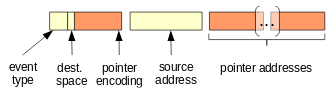
![]() AntTracks – Memory event tracing (also see here). In order to analyze delays due to garbage collection, one has to understand what goes on in the heap in terms of allocations, reclamations and object moves (collectively called memory events). Since it is not viable to monitor these events in real time we produce a binary trace in which all events are stored in the order of their occurrence. In case of an observed delay the trace can be analyzed offline in AntTrack’s analysis tool. The tool focuses on low memory consumption and enables us to replay the memory events, to reconstruct the heap at any garbage collection point and to inspect the heap’s state. It also allows us to mine for patterns that might have caused the problem. Our traces contain detailed information about object allocations, reclamations, and GC moves. For capturing the allocations we modified the HotSpot client JIT compiler as well as the bytecode interpreter. For capturing GC events we instrumented various of HotSpot’s garbage collectors, such as the Parallel Old GC, the G1 GC, and more. By using sophisticated instrumentation and buffering techniques, the tracing overheads could be kept down to 5% on average.
AntTracks – Memory event tracing (also see here). In order to analyze delays due to garbage collection, one has to understand what goes on in the heap in terms of allocations, reclamations and object moves (collectively called memory events). Since it is not viable to monitor these events in real time we produce a binary trace in which all events are stored in the order of their occurrence. In case of an observed delay the trace can be analyzed offline in AntTrack’s analysis tool. The tool focuses on low memory consumption and enables us to replay the memory events, to reconstruct the heap at any garbage collection point and to inspect the heap’s state. It also allows us to mine for patterns that might have caused the problem. Our traces contain detailed information about object allocations, reclamations, and GC moves. For capturing the allocations we modified the HotSpot client JIT compiler as well as the bytecode interpreter. For capturing GC events we instrumented various of HotSpot’s garbage collectors, such as the Parallel Old GC, the G1 GC, and more. By using sophisticated instrumentation and buffering techniques, the tracing overheads could be kept down to 5% on average.
Lengauer, P; Bitto, V.; Mössenböck, H.: Accurate and Efficient Object Tracing for Java Applications. 6th Int’l Conf. on Performance Engineering (ICPE’15), Jan 31-Feb 4, 2015, Austin, TX, USA.
Bitto, V.; Lengauer, P; Mössenböck, H.: Efficient Rebuilding of Large Java Heaps From Event Traces. 12th Int’l Conf. on Principles and Practice of Programming in Java (PPPJ’15), Sept 8-11, 2015, Melbourne, FL, USA.
Lengauer P.; Bitto V.: Building Custom, Efficient, and Accurate Memory Monitoring Tools for Java Applications. 7th Int’l Conf. on Performance Engineering (ICPE’16), March 12 – 16, 2016, Delft, The Netherlands
 AntTracks – Pointer information. Additionally to information about object allocations and object movements by the garbage collector, the AntTracks VM is capable of recording pointer information. We extended the format of move events, i.e., events that are sent when the garbage collector moves an object, to additionally store information about the moved object’s pointers. Further, new pointer events have been introduced, treating special cases that can occur due to various reasons such as multi-threaded object movement. To avoid unnecessary overhead, we further exploit the JVM’s card table. This allows us to send pointer events only for objects that have been effectively changed since the last garbage collection.
Lengauer, P.; Bitto, V.; Fitzek, S.; Weninger, M.; Mössenböck, H.: Efficient Memory Traces with Full Pointer Information. 13th Int’l Conf. on Principles and Practices of Programming on the Java Platform: Virtual Machines, Languages, and Tools (PPPJ’16), August 29 – September 02, 2016, Lugano, Switzerland
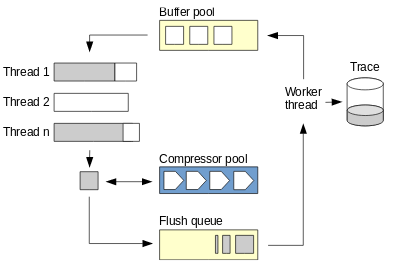 AntTracks – Trace handling. The AntTracks VM relies on a very compact, mostly pre-compilable event format. No event contains redundant information and every information that can be reconstructed offline is omitted, which allows representing memory events with around 5 bytes per event on average. To further reduce the resulting trace file’s size, we developed an on-the-fly compression technique for tracing data with minimal influence on the run time. Additionally, we show how to overwrite old parts of the trace to circumvent its unlimited growth, but almost without losing vital information, a mechanism we call trace rotation. Trace rotation leads to some interesting challenges, especially when considering its performance impact and a minimalistic event format: Finding suitable points for rotation to not corrupt the trace file and avoiding information loss by evacuating still needed data from the file part that is going overwritten.
Lengauer, P.; Bitto V.; Mössenböck, H.: Efficient and Viable Handling of Large Object Traces. 7th Int’l Conf. on Performance Engineering (ICPE’16), March 12 – 16, 2016, Delft, The Netherlands
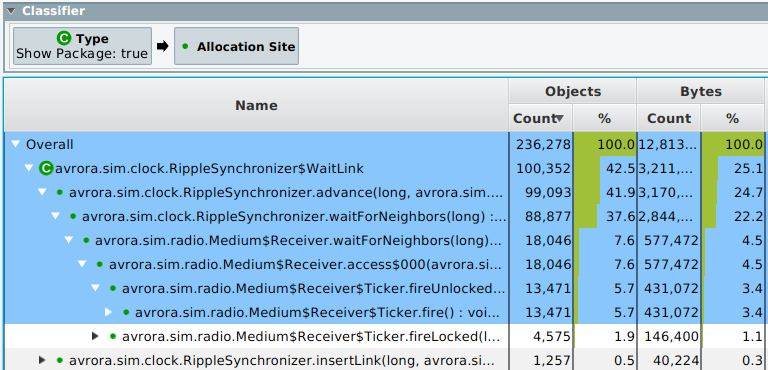 AntTracks – User-centered data analysis. State-of-the-art memory monitoring tools are often too inflexible and don’t let the users explore the heap in the way they want. This work focuses on extending AntTracks’s heap state analysis capabilities by adding user-centered analysis features. A central part of every memory monitoring tool is grouping the objects in the heap based on some criterion, e.g., the object’s type. While most analysis tools support grouping by a single criterion, we extended AntTracks to support heap object grouping based on multiple criteria (called heap object classifiers), e.g., first by the object’s type, and then by its allocation site. The number and order of combined classifiers is not restricted, enabling users to group the heap in a multitude of ways. Furthermore, AntTracks provides a large number of predefined heap object classifiers, yet the user can write new classifiers, tailored to their needs, and load them in AntTracks.
Weninger, M.; Lengauer, P.; Mössenböck, H.: User-centered Offline Analysis of Memory Monitoring Data. 8th Int’l Conf. on Performance Engineering (ICPE’17), April 22 – 26, 2017, L’Aquila, Italy
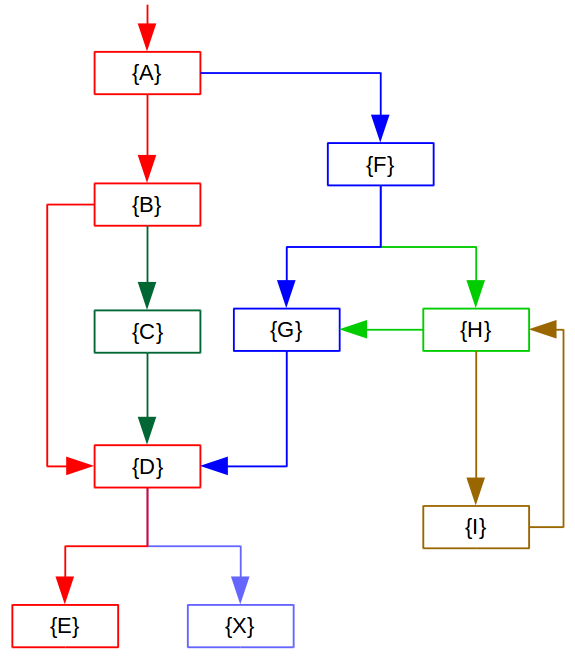 DuckTracks – Path-based object allocation tracking. Efficiently tracking an application’s object allocations is of interest for areas such as memory leak detection or memory usage optimization. The state-of-the-art approach of instrumenting every allocation site with a counter introduces considerable overhead. This makes allocation tracking in a production environment unattractive. Our approach reduces this overhead by instrumenting control flow paths instead of allocation sites and dynamically determining the hot path through a method. Our ultimate goal is to reduce the amount of required counter increments by such a degree that using it in production environments becomes feasible. First measurements already show a reduction of required increments of up to 30% compared to the state of the art.
Fitzek, S.; Lengauer, P.; Mössenböck, H.: DuckTracks: Path-based Object Allocation Tracking. 8th Int’l Conf. on Performance Engineering (ICPE’17), April 22 – 26, 2017, L’Aquila, Italy
 Memory Benchmark Study: DaCapo, DaCapo Scala, and SPECjvm2008. Benchmark suites are an indispensable part of scientific research to compare different approaches against each another. The diversity of benchmarks is an important asset to evaluate novel approaches for effectiveness and weaknesses. We describe the memory characteristics and the GC behavior of commonly used Java benchmarks, i.e., the DaCapo benchmark suite, the DaCapo Scala benchmark suite and the SPECjvm2008 benchmark suite. The derived data can serve as a useful guide to select benchmarks in accordance with desired application characteristics on modern virtual machines as well as with different compilers and garbage collectors. It also helps to put results that are based on these benchmarks into perspective.
Lengauer, P.; Bitto, V.; Mössenböck, H.; Weninger, M.: A Comprehensive Java Benchmark Study on Memory andGarbage Collection Behavior of DaCapo, DaCapo Scala, and SPECjvm2008. 8th Int’l Conf. on Performance Engineering (ICPE’17), April 22 – 26, 2017, L’Aquila, Italy
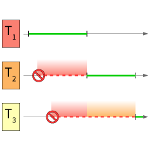
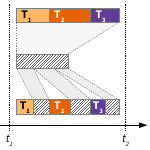
Incremental stack tracing. This technique is an alternative to asynchronous stack sampling (described below). Instead of decoding the full stack for every sample, we decode only parts of it. When a sample is taken, only the topmost frame is decoded and the return address of the current method is patched so that it will return to a stub that will decode the caller frame and again patch the caller’s return address. In that way, the calling context tree is built incrementally and every stack frame is decoded only once. For selecting the sampling points, we also tried a new idea: Like with JVMTI sampling, we take samples only at safepoint locations. However, we do not wait until all threads have reached such locations (which is a bottleneck in JVMTI sampling) but rather start the sampling when n threads have reached their safepoint locations, where n is the number of cores on the machine. The efficiency of incremental stack sampling is between that of JVMTI sampling and asynchronous stack sampling. For the DaCapo benchmarks, we achieved overheads of 2%, 7%, and 23% for 100, 1000, and 10000 samples per second, which is still 2-4 times faster than traditional JVMTI sampling.
Hofer, P.; Gnedt, D.; Mössenböck, H.: Lightweight Java Profiling with Partial Safepoints and Incremental Stack Tracing. 6th Int’l Conf. on Performance Engineering (ICPE’15), Jan 31 – Feb 4, 2015, Austin, TX, USA.
 Virtualization time accounting. With hardware virtualization, the hypervisor must frequently suspend one VM to execute another, “stealing time” from the suspended VM. Nevertheless, the stolen time is accounted as CPU time to the scheduled threads in the suspended VM. We devised a technique to reconstruct to what extent the threads of an application running in a virtualized environment are affected by suspension. We accomplish this by periodically sampling the CPU time of the individual threads as well as the steal time for the entire VM. We then assign fractions of the VM’s steal time to each thread at the ratio of the thread’s CPU time to the entire VM’s CPU time. Using this technique, we were able to correct measurements of CPU time consumption.
Hofer, P.; Hörschläger, F.; Mössenböck, H.: Sampling-based Steal Time Accounting under Hardware Virtualization. Work in progress paper, 6th Int’l Conf. on Performance Engineering (ICPE’15), Jan 31 – Feb 4, 2015, Austin, TX, USA.
 Automatic GC tuning. The Java HotSpot VM comes with 6 different garbage collectors, each of which has dozens of parameters for setting the size of local buffers, the tenuring age, the adaptation policies, and many other things. Depending on the application’s memory profile and workload, different parameter settings must be used to achieve optimal GC performance. Manual tuning is time-consuming and difficult. We therefore developed a technique for automatic GC parameter tuning based on a hill-climbing approach, which finds the optimum parameter settings for a given application and workload. The target function can be arbitrary (e.g., the overall GC time, the maximum GC pause time, or the maximum heap usage). Using a large number of benchmarks from the well-known DaCapo 2009 and SPECjbb 2005 benchmark suites, the GC times could be reduced by up to 77% and by 35% on average compared to the default parameter settings.
Lengauer, P.; Mössenböck, H.: The Taming of the Shrew: Increasing Performance by Automatic Parameter Tuning for Java Garbage Collectors. 5th Intl. Conf. on Performance Engineering (ICPE’14), March 22-26, 2014, Dublin, Ireland, pp.111-122.
Also read the Dynatrace APM blog article
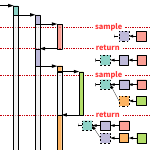
 Asynchronous stack sampling. We developed efficient techniques for computing execution profiles and building dynamic calling context trees for Java programs. We used a sampling approach exploiting a feature of the Linux perf monitoring subsystem to produce timer interrupts at which a fragment of every stack is copied to a buffer. The fragments are then analyzed asynchronously by a background thread running on a separate core. In contrast to other Java-based sampling techniques (e.g., using JVMTI), samples can be taken anywhere and not only at safepoint locations, thus increasing the accuracy of the profiles and reducing the run-time overhead at the same time. The average overheads for the DaCapo benchmarks were 1%, 2%, and 10% for sampling rates of 100, 1000, and 10000 samples per second, which is about 5 times faster than the commonly used synchronous sampling in safepoints with JVMTI.
Hofer, P; Mössenböck, H: Efficient and Accurate Stack Trace Sampling in the Java Hotspot Virtual Machine. Work in progress paper, 5th Intl. Conf. on Performance Engineering (ICPE’14), March 22-26, 2014, Dublin, Ireland, pp.277-280.
Hofer, P.; Mössenböck, H.: Fast Java Profiling with Scheduling-aware Stack Fragment Sampling and Asynchronous Analysis. 11th Intl. Conf. on Principles and Practice of Programming in Java (PPPJ’14), Sept. 23-26, 2014, Cracow, Poland, pp.145-156.
Feature-based memory monitoring. Very-large-scale software systems are often structured as software product lines consisting of features that can be individually selected by users for being added to the application. When selecting features it is useful to know their “costs” in terms of memory consumption. We developed a technique for capturing object allocations and deallocations and associating them with program features.
Lengauer, P.; Bitto, V.; Angerer, F.; Grünbacher, P.; Mössenböck, H.: Where Has All My Memory Gone? Determining Memory Characteristics of Product Variants using Virtual-Machine-Level Monitoring. 8th Intl. Workshop on Variability Modelling of Software-intensive Systems (VaMoS’14), January 22-24, 2014, Nice, pp.1-8.
Collecting GC metrics. We instrumented the JVM so that it collects data about factors that influence GC times, such as the number of allocated objects/bytes between GC runs, the number of objects/bytes reclaimed per GC run, the average and maximum age of surviving objects, the number of references between objects, and the average distance of references (which influences the caching behavior).
Lengauer, P.: VM-Level Memory Monitoring for Resolving Performance Problems. Doctoral Symposium at SPLASH’13, October 28, 2013, Indianapolis, USA, pp.29-32.
Team
Team Members
 |
Verena Bitto | Researcher |
 |
Peter Chalupar | Student Researcher |
 |
Stefan Fitzek | Student Researcher |
 |
Elias Gander | Student Researcher |
 |
David Gnedt | Student Researcher |
 |
Peter Hofer | Researcher |
 |
Mario Kahlhofer | Student Researcher |
 |
Philipp Lengauer | Research Associate |
 |
Lukas Makor | Student Researcher |
 |
Hanspeter Mössenböck | Senior Research Associate |
 |
Andreas Schörgenhumer | Researcher |
 |
Markus Weninger | Researcher |
 |
Reinhard Wolfinger | Senior Research Associate |
 |
Stefan Wurzinger | Student Researcher |
 |
Paul Grünbacher | Head of Laboratory |